Shiba Inu Price Struggles as Bullish Breakout Stalls
- Slava Jefremov
- Aug 1, 2025
- 3 min read

Updated: Dec 15, 2025

Introduction
Despite posting an impressive 15% gain over the last month, Shiba Inu (SHIB) has seen its bullish momentum grind to a halt. The token has struggled to find direction in the past week, with Shiba Inu price action remaining nearly flat in a market-wide consolidation. While a promising technical pattern suggests a potential breakout is on the horizon, a closer look at on-chain data and key indicators reveals significant headwinds from large-scale holders and weakening buyer conviction.
Key Takeaways
A significant increase in SHIB exchange reserves suggests large-scale holders may be preparing to sell, creating downward pressure on the price.
Key momentum indicators like the Money Flow Index (MFI) are declining, while Bear Power is on the rise, indicating that buyer demand is fading.
SHIB's price remains confined within a bullish falling wedge pattern, with critical support at $0.0000128. A break below $0.000010 could invalidate the potential for a bullish reversal.
Whale Activity Signals Potential Sell-Off
A primary factor undermining SHIB's recent performance is the noticeable spike in tokens held on cryptocurrency exchanges. On-chain data from July 28th showed that exchange reserves peaked at a monthly high of 84.9 trillion SHIB. This trend indicates that "whales" or large-scale holders are moving their assets from private wallets to exchanges, a common precursor to selling.
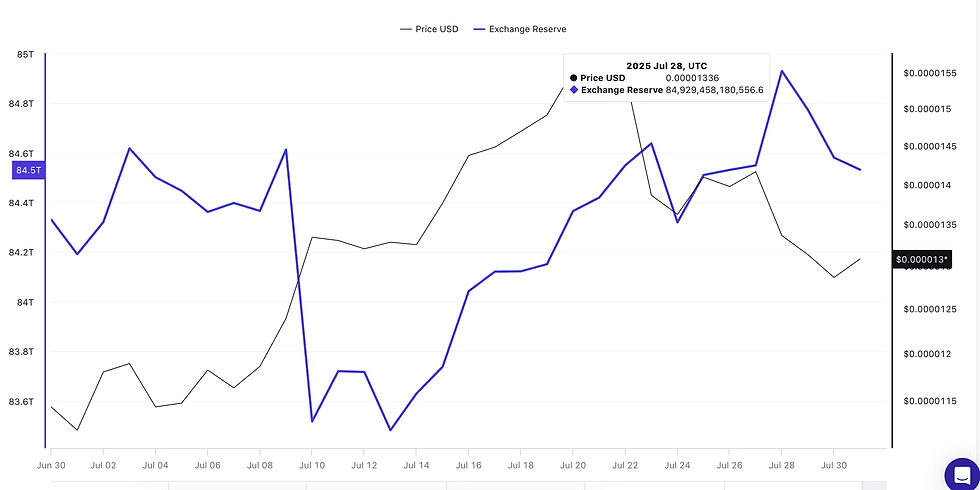
Although these reserves have slightly decreased since the peak, the substantial volume remaining on exchanges poses a considerable risk for a deeper price correction. This influx of supply, consistent with recent data showing negative net flows from large holders, creates significant liquidation pressure and makes it challenging for SHIB to sustain any upward rally.
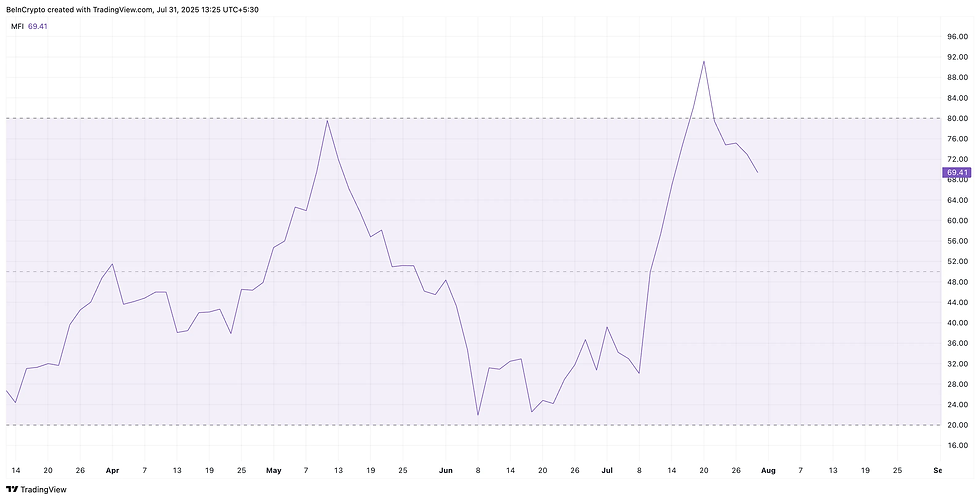
Technical Indicators Point to Waning Momentum
The waning enthusiasm from buyers is further confirmed by key momentum indicators. The Money Flow Index (MFI), which measures the flow of capital into or out of an asset based on price and volume, has experienced a sharp decline from an overbought level of 91 to 69 within the last ten days. This drop suggests that capital is flowing out of SHIB and that buyers are hesitant to enter the market, even at lower prices.
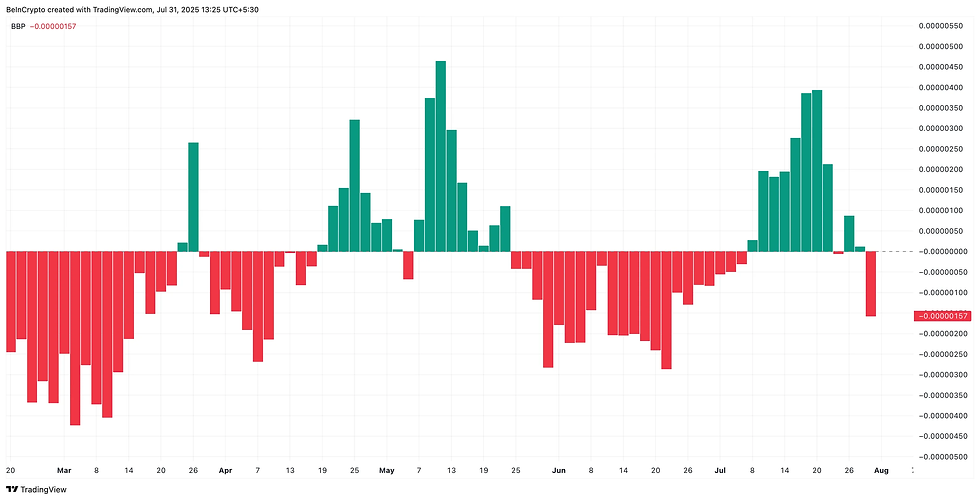
This is corroborated by the Bull-Bear Power (BBP) indicator, which now clearly shows that sellers are dominating the short-term price action. The appearance of a prominent red bar in the BBP signifies strengthening bearish control, overpowering the previously weakening bullish momentum. Together, these indicators paint a picture of fading demand and growing seller strength.
SHIB Price Analysis
From a technical standpoint, SHIB's price is currently consolidating within a falling wedge pattern on the 2-day chart—a formation that typically resolves in a bullish breakout. Using a longer timeframe like the 2-day chart helps to filter out market noise from short-term fluctuations.
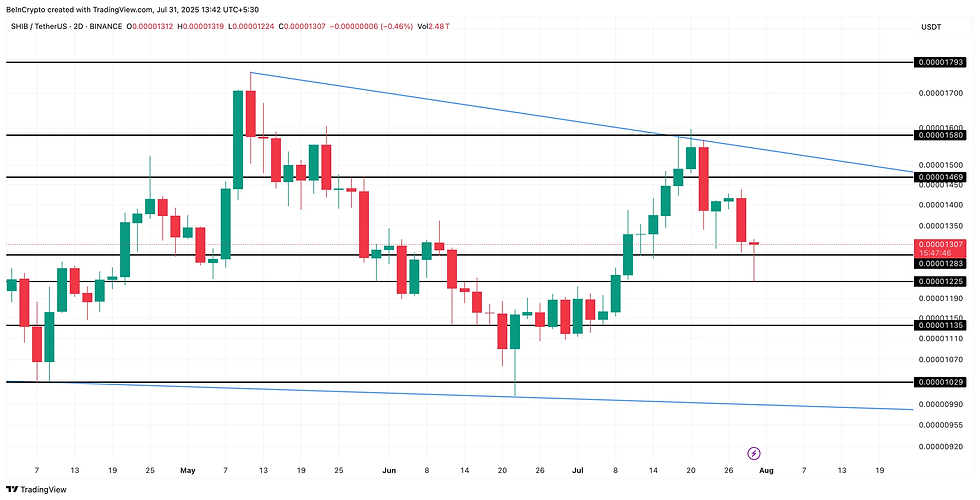
However, the asset remains pinned near the $0.0000130 mark. The immediate and most critical support level to watch is $0.0000128. Should this support fail, SHIB could see a further decline toward $0.0000122 and, subsequently, the psychological level of $0.000010. A sustained drop below $0.000010 would likely invalidate the bullish structure of the wedge pattern.
Conversely, for the bulls to regain control, SHIB must achieve a decisive breakout above the wedge's resistance. The initial hurdles lie at $0.0000146 and $0.0000158. A successful move past these levels would confirm the bullish breakout and could trigger a more substantial rally.
Conclusion
In summary, Shiba Inu finds itself at a critical juncture. While the technical chart presents a bullish falling wedge pattern suggesting the potential for a significant upward move, this optimism is heavily tempered by bearish on-chain signals. The influx of SHIB to exchanges by large holders, coupled with declining buying momentum shown by the MFI and BBP, indicates that the path of least resistance may be downwards in the short term. Traders and investors should exercise caution, closely monitoring the key support at $0.0000128. A confirmed breakout or breakdown from the current wedge will likely dictate SHIB's next major price trend.
Frequently Asked Questions
What is a falling wedge pattern?
A falling wedge is a technical chart pattern that signals a potential bullish reversal. It is formed by two converging trend lines, with both sloping downward. It suggests that selling pressure is losing steam, and a breakout to the upside may be imminent.
Why is an increase in SHIB exchange reserves considered bearish?
When large holders move their tokens from private wallets to exchanges, it often indicates an intention to sell. This increases the available supply on the market, which can lead to selling pressure and drive the price down if demand does not keep pace.
What does the Money Flow Index (MFI) indicate for SHIB?
The MFI for SHIB has dropped from 91 to 69, indicating that money is flowing out of the asset. A reading above 80 is considered overbought, while a reading below 20 is oversold. The current decline suggests that buying pressure is weakening significantly.


Comments