Bitcoin Under Pressure: ETF Outflows Surpass $1 Billion, Eyes on $111,000 Support
- Slava Jefremov
- Aug 6, 2025
- 3 min read

Updated: Dec 12, 2025

Introduction
Bitcoin is facing significant headwinds as its spot exchange-traded funds (ETFs) have now registered four consecutive days of net outflows. This withdrawal streak, the longest of its kind since April, has seen institutional capital retreat from the market, casting a shadow on the cryptocurrency's recent bullish momentum and suggesting a potential retest of lower support levels.
Key Takeaways
Sustained ETF Outflows: Spot Bitcoin ETFs have seen over $1 billion in net outflows over the last four trading days, indicating a decisive shift in institutional sentiment.
Institutional Retreat: The very investors who fueled Bitcoin's recent rally are now reducing their exposure, removing a critical pillar of support for the market.
Bearish Technicals: On-chain data and key technical indicators are aligning to suggest further downside, with sellers appearing to gain control.
Critical Price Levels: Bitcoin's price is struggling below key resistance at approximately $118,000. Continued selling pressure could push the asset down towards the crucial support level of $111,000.
Institutional Conviction Wanes as ETF Selloff Intensifies
The sustained selloff in spot Bitcoin ETFs highlights a weakening conviction among the institutional players who were instrumental in Bitcoin's recent surge. According to data from SosoValue, net outflows from these investment vehicles have now eclipsed $1 billion in just four days.

This development is particularly noteworthy when contrasted with the market dynamics of July. That month alone, spot BTC ETFs attracted over $6 billion in net inflows, which was a primary catalyst for driving Bitcoin to a new all-time high of around $122,054. The current reversal from aggressive buying to consistent selling suggests that this institutional support has, for now, evaporated, placing significant downward pressure on BTC's valuation.
On-Chain and Technical Indicators Signal Caution
The bearish sentiment is not confined to ETF flows. On-chain data corroborates this cautious outlook, as evidenced by Bitcoin's long/short ratio, which currently stands at 0.93.
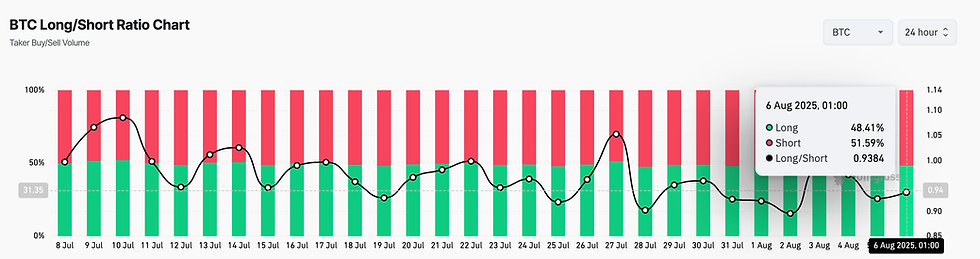
The long/short ratio measures the balance between bullish (long) and bearish (short) positions in the futures market. A ratio below 1.0 indicates that more traders are betting on a price decline than on a price increase, signaling a predominantly bearish market sentiment.
Further analysis of the daily chart shows Bitcoin's price trading below its Parabolic Stop and Reverse (SAR) indicator. This indicator, which helps identify trend direction and potential reversals, has its dots positioned above the price, forming a dynamic resistance level at $118,086. When the Parabolic SAR rests above the price, it signifies that the market trend is bearish and that selling pressure is dominant.
Price Analysis: The Path to $111,000
With bearish signals converging, all eyes are on key support levels. If the current selling pressure from ETF outflows and negative sentiment continues, Bitcoin’s price could be driven down to test the next major support zone. The primary bearish target in this scenario is located at approximately $111,855, often rounded to $111,000 by traders.

However, a market reversal is always possible. Should a new wave of demand enter the market and absorb the selling pressure, Bitcoin could challenge its current resistance. A successful break above the Parabolic SAR could empower bulls to push the price back towards $116,952.
Conclusion
The short-term outlook for Bitcoin has turned decidedly cautious. The combination of multi-day ETF outflows exceeding $1 billion, a bearish on-chain sentiment reflected in the long/short ratio, and technical indicators like the Parabolic SAR all point towards a potential price correction. The institutional fervour that propelled Bitcoin to new heights has been replaced by risk-off behaviour. For now, the $111,000 level remains the most critical support to watch, and a break below it could signal a deeper market downturn.
Frequently Asked Questions
What are Bitcoin ETFs and why do their flows matter?
A spot Bitcoin ETF (Exchange-Traded Fund) is a financial product that allows investors to gain exposure to Bitcoin's price without owning the cryptocurrency directly. The flow of money into (inflows) or out of (outflows) these ETFs is considered a strong indicator of institutional sentiment. Large and sustained outflows, as seen recently, suggest that major investors are selling their positions and anticipate a price drop.
What does a long/short ratio of 0.93 specifically mean?
A long/short ratio of 0.93 means that for every 100 traders with bullish (long) positions expecting the price to rise, there are approximately 107 traders with bearish (short) positions expecting the price to fall (100 / 0.93 ≈ 107.5). A ratio below 1.0 signifies that bearish sentiment is currently stronger than bullish sentiment in the futures market.
Is Bitcoin guaranteed to drop to $111,000?
No, a drop is not guaranteed. Technical and sentiment analysis provide a probabilistic outlook, not a certainty. The $111,000 level is identified as a key support based on current data and trends. The market is highly dynamic, and a sudden influx of buying pressure, positive news, or a shift in macroeconomic factors could invalidate this projection.


Comments